Taming 2 Million Rows of Chaos…
Imagine a monolithic, unmanageable dump where job postings from across the globe had been piling up for years: typos, currency mismatches, broken HTML tags, and corrupted timestamps. Try opening a dataset like that in Excel, and it will just crash instantly.
My goal was to turn this raw data graveyard into a fast, responsive web portal. I engineered custom data-cleaning pipelines: filtered out orphaned and malformed records, normalized currency conversions, and ingested 411,999 pristine rows into the database. All the heavy lifting happens under the hood, so the end user opens the page and gets instant, actionable insights.
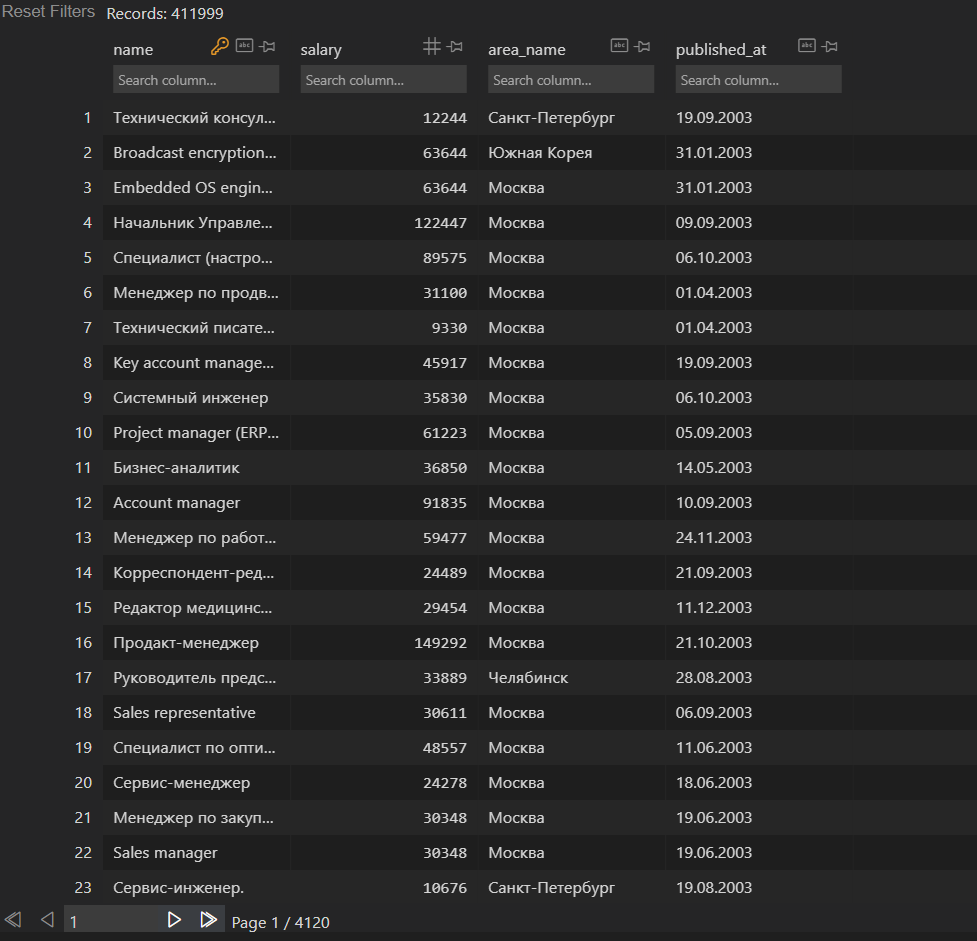
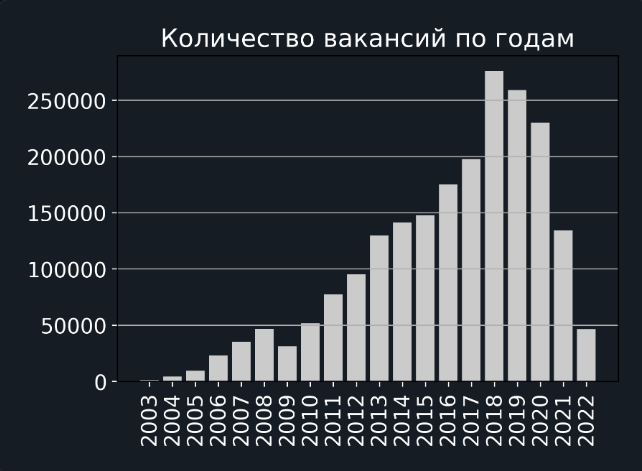
Raw labor market records processed & parsed
How to process 2M records without killing the server?
Divide and conquer.
A naive single-threaded script would quickly choke on memory limits. To keep the server responsive, I partitioned the massive archive into yearly timeframes and ran batch processing concurrently.
def asynchronousProcessing(self):
    """Concurrent batch processing across yearly slices"""
    files = os.listdir(path='./years-csv')

    # Distribute partitions across worker threads: 100% CPU utilization, zero memory leaks

    with pool.ThreadPoolExecutor(max_workers=len(files)) as p:
        p.map(self.parserCSVByYear, files)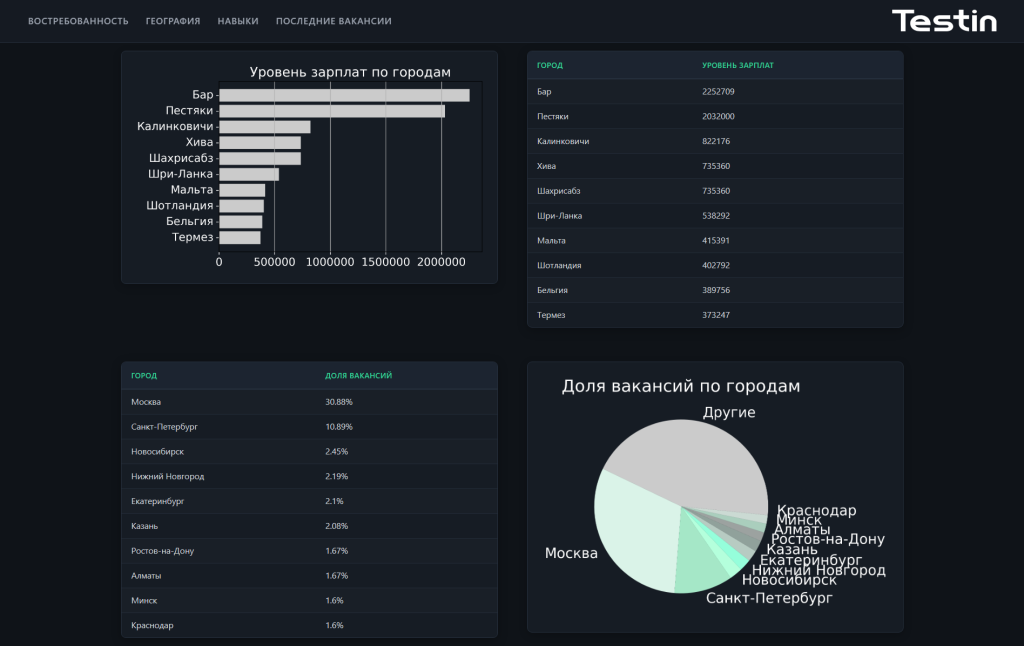
From Raw Numbers to Actionable Analytics
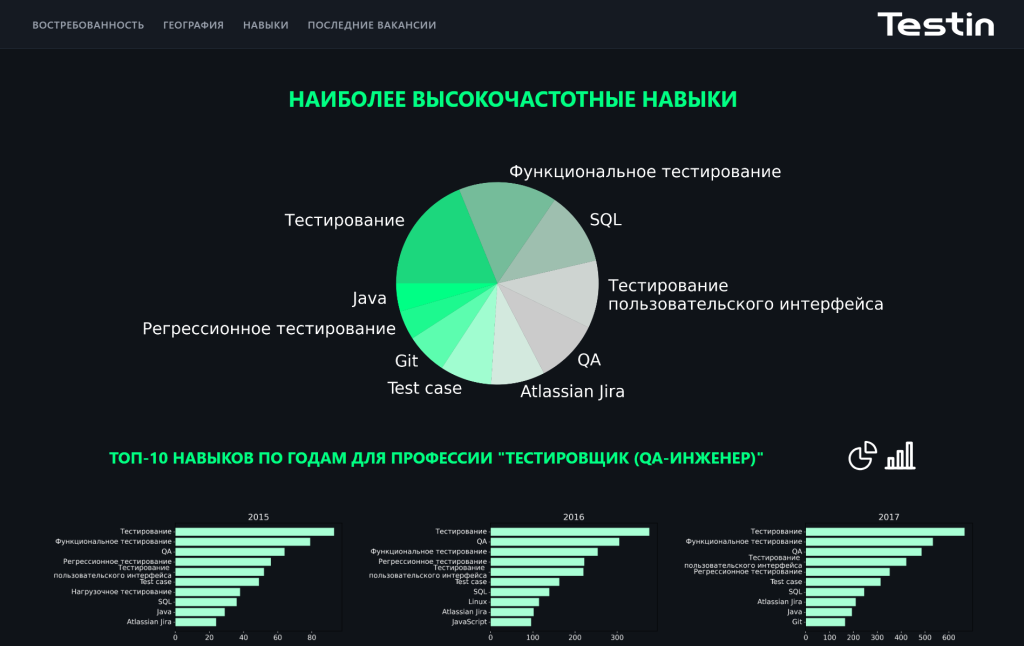
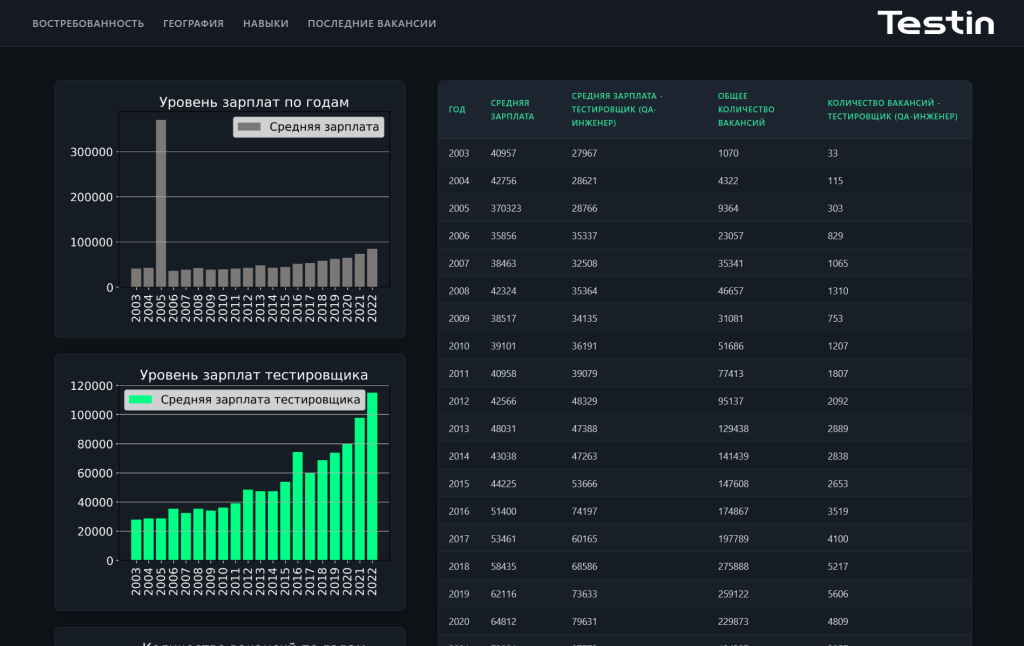
Users never touch messy spreadsheets directly. They pick a role (e.g., QA Engineer) and immediately get a real-time snapshot: actual salary ranges, geographic hiring density, and in-demand core skill sets.
Function over form
A lean, high-density interface built for sub-second table rendering. The system even compiles these analytical slices into ready-to-share PDF and Excel reports for HR teams and leadership.
Under the Hood
Core architectural principles behind the speed and stability
Parallel Processing
Instead of locking up the system for half a day to process 400k rows, execution was offloaded into concurrent worker threads. Total processing time dropped by 3x.
Automated Test Coverage
Mission-critical calculation logic (dynamic currency conversions, edge-case salary rounding) is covered with unit tests. Exchange rates fluctuate, but calculations never break.
Resilient Caching
When external upstream services or APIs throttle or go down, the analytics engine stays snappy by relying on its pre-indexed, locally optimized storage layer.
Specialization Filtering (QA)
Out of a 2.1M raw dataset, the algorithmic filter isolates relevant QA vacancies using fuzzy keyword matching, synonym maps, and seniority matrices.
Proof that smart multithreading and clean algorithms can crunch millions of records even on modest hardware — zero cloud bloat, pure engineering efficiency.
Big data doesn’t always need a big budget

*Archived project (Data Processing Pipeline). Full source code and setup instructions are available on GitHub.